Hi and thanks to @jeremy and @rachel for this wonderful class!
I’m starting the Lesson 3 lecture video, and the review of the key concepts, and I’m walking through the convolution-intro.ipynb notebook. I don’t have Tensorflow installed currently, so I followed @jeremy’s advice (which now I cannot find) and used the Keras MNIST dataset instead. Now, I’m getting strange results:
- The number of images in the Keras dataset is different. TF has 55000, and Keras has 60000.
- The ordering of images is different. The 0-th image in TF is number ‘7’, but the 0-th in Keras is ‘5’.
- Most concerning is that the images demonstrating the
corrtopdetails are very different.
Details:
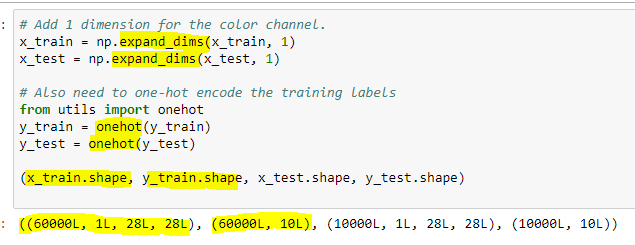
Getting the dataset from Keras:
from keras.datasets import mnist
(x_train, y_train), (x_test, y_test) = mnist.load_data() # saves to /root/.keras/datasets/mnist.pkl.gz
Then I assigned the images and labels variables as follows:
images=x_train
labels=y_train
n=len(images)
images.shape
Output: (60000, 28, 28) (NOTE: TF was (55000, 28, 28)).
I computed the corrtop value using the existing code:
corrtop = correlate(images[inspect_idx], top)
Here are the plots of the resulting corrtop data. The original TF versions on the left, mine on the right. Note that the numeral ‘7’ is a different index and a different sample, so the shape is different. That’s not my concern. My concern is the overall appearance. It looks like something is wrong with the filters or something.
plot(corrtop[dims])
TF: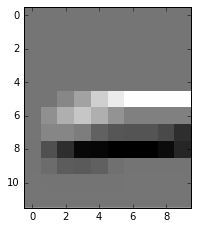 Keras:
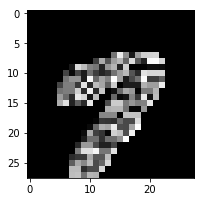
plot(corrtop)
TF: 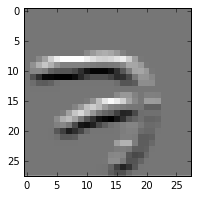 Keras:
Can anyone shed light on why such a difference here? The only change I’ve made really is to use the Keras dataset instead of the Tensorflow dataset.
Thanks much!