I’m testing the Lesson 2 Notebook on Amazon Rainforest on my personal DL rig (Ubuntu 16.02 + GTX 1080Ti + 16Gb RAM and 50Gb Swap), using GNOME System Monitor and PSensor.
It crashed repeatedly before, getting “OOM” (Out Of Memory) errors around 3/4 of the work.
It seems to keep all the previous cell runs in memory, like here I’m on Cell 24 with sz=128
and my system, which I rebooted prior to launching the notebook to start from zero, has 100% of RAM used (16Gb) and 46% of Swap (22Gb).
Looking at the processes in Gnome, I see 15x ‘python’ with memory from 3.7Gb to 7.5Gb.
Is that normal ?
Any way to do some memory purge after an Epoch run ?
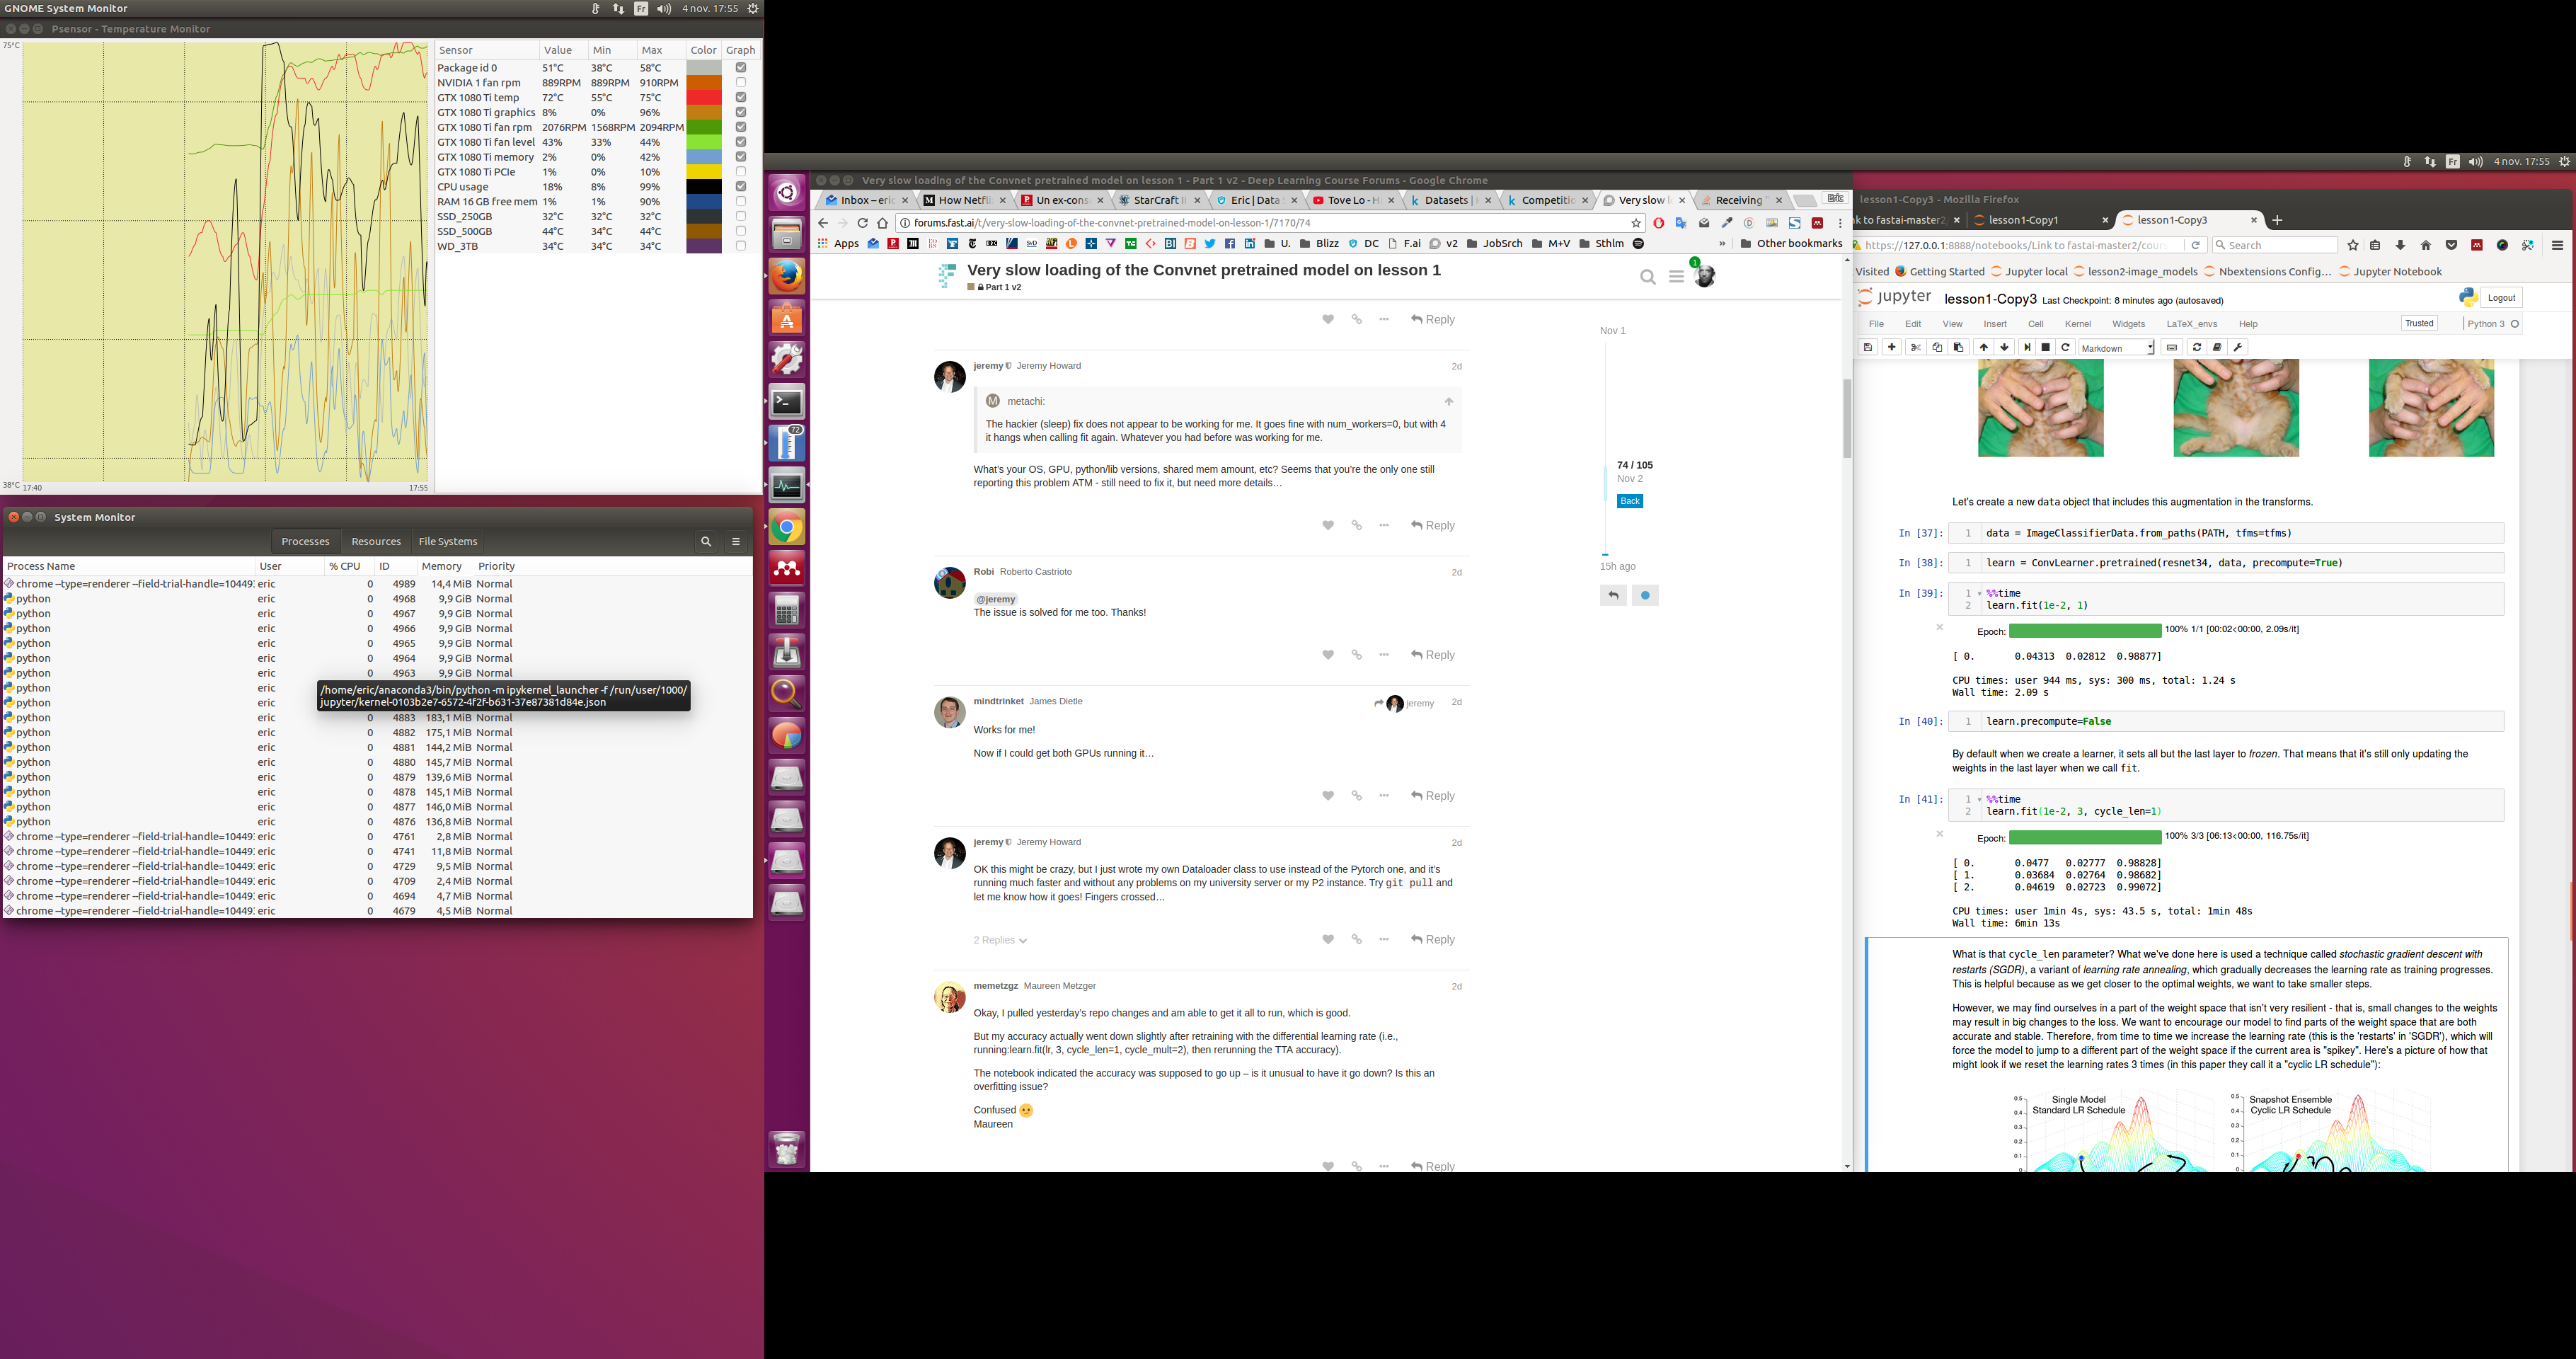
So I downloaded the fast.ai github in a new directory (fastai-master2), and went back to Lesson 1 to see if I had the same issue;
and it seems to be so in Cell 41 learn.fit(1e-2, 3, cycle_len=1)
The RAM goes from 4.5Gb to 16Gb, the Swap takes over and reaches 40Gb.
Once the command is run, the Swap stays at 8Gb and the RAM at 16Gb load, plus nine “python” processes in GNOME listed at 9.7GiB each.
Here are two screenshots, showing the Swap getting full, then the remaining ‘python’ processes with 9.7GiB plus.
(I’m using two monitors, a 1440p horizontal on the right side and a 1080p vertical on the left side: the apps monitoring are on the left one).
That might fix the problem, when you use torch.utils.data.DataLoader instead of fastai.dataloader.DataLoader class, but the real problem might be in DataLoader. I see that fastai is using a ProessPoolExecutor while the torch -> DataLoader uses torch.multiprocessing instead of Python’s concurrent.futures.multiprocessing. I remember from a talk that Soumith (PyTorch) gave that they forked the Multiprocessing module of Python to make it significantly faster for their use.
@jeremy - Unless there’s a need to the cusom ProcessPoolExecutor it might be better to delegate the iteration to DataLoaderIter as defined in torch.utils.data.DataLoader.
@jeremy - Ah…now I understand why you had to use Python’s ProcessPoolExecutor. I also see some notes on OpenCV and Pytorch compatibility issues (https://github.com/opencv/opencv/issues/9501) Couple of thoughts -
I found pytorch tensor ops very slow indeed (such that I couldn’t effectively utilize the GPU, since was waiting for preprocessing all the time). OpenCV was faster than other options I looked at too.
To see where it’s used, just grep the code for cv2. It’s used for data augmentation.
Only two people so far have found RAM problems with ProcessPoolExecutor - I don’t know why it’s happening, and I’d love help fixing it… there must be something different about those two software configs somehow.
@jamesrequa@EricPB One idea is to try skipping precomputing activations - that way we can see if the problem is with bcolz. E.g. first allow the activations to be precomputed, then set precompute=False, restart the kernel, and see if you still see a problem.
Thanks Jeremy. I am trying it out with the new AMI on a P2 instance. Since it has 60GB of RAM, this might not be a problem there. It doesn’t help with the personal DL Box that @EricPB has. But might be worthwhile to try it on P2 with the AMI to make sure it’s not a general problem.
Thanks. I didn’t see the problem with the P2 instance. Looks like DataLoader is using num_workers=0 by default. It might be worthwhile to set this value to 4 or 8 if someone’s having memory issues in the call to - ImageClassifierData as - data = ImageClassifierData.from_paths(..., num_workers=4). I am not sure if that’s what’s causing the RAM to increase. Just a suggestion
I tried this but still see the same problem. I can see my RAM filling up both while I initially allow the activations to be precomputed and later when I restart the notebook and set precompute=False anytime I run learn.fit the same thing happens.
@jamesrequa - One thing I might suggest is try it on AWS G2.2xlarge and see if it works well. It has only 15GB of RAM and might be a better comparison to your local machine. Just to isolate if it’s your local environment or if the task requires much more than 15 GB.
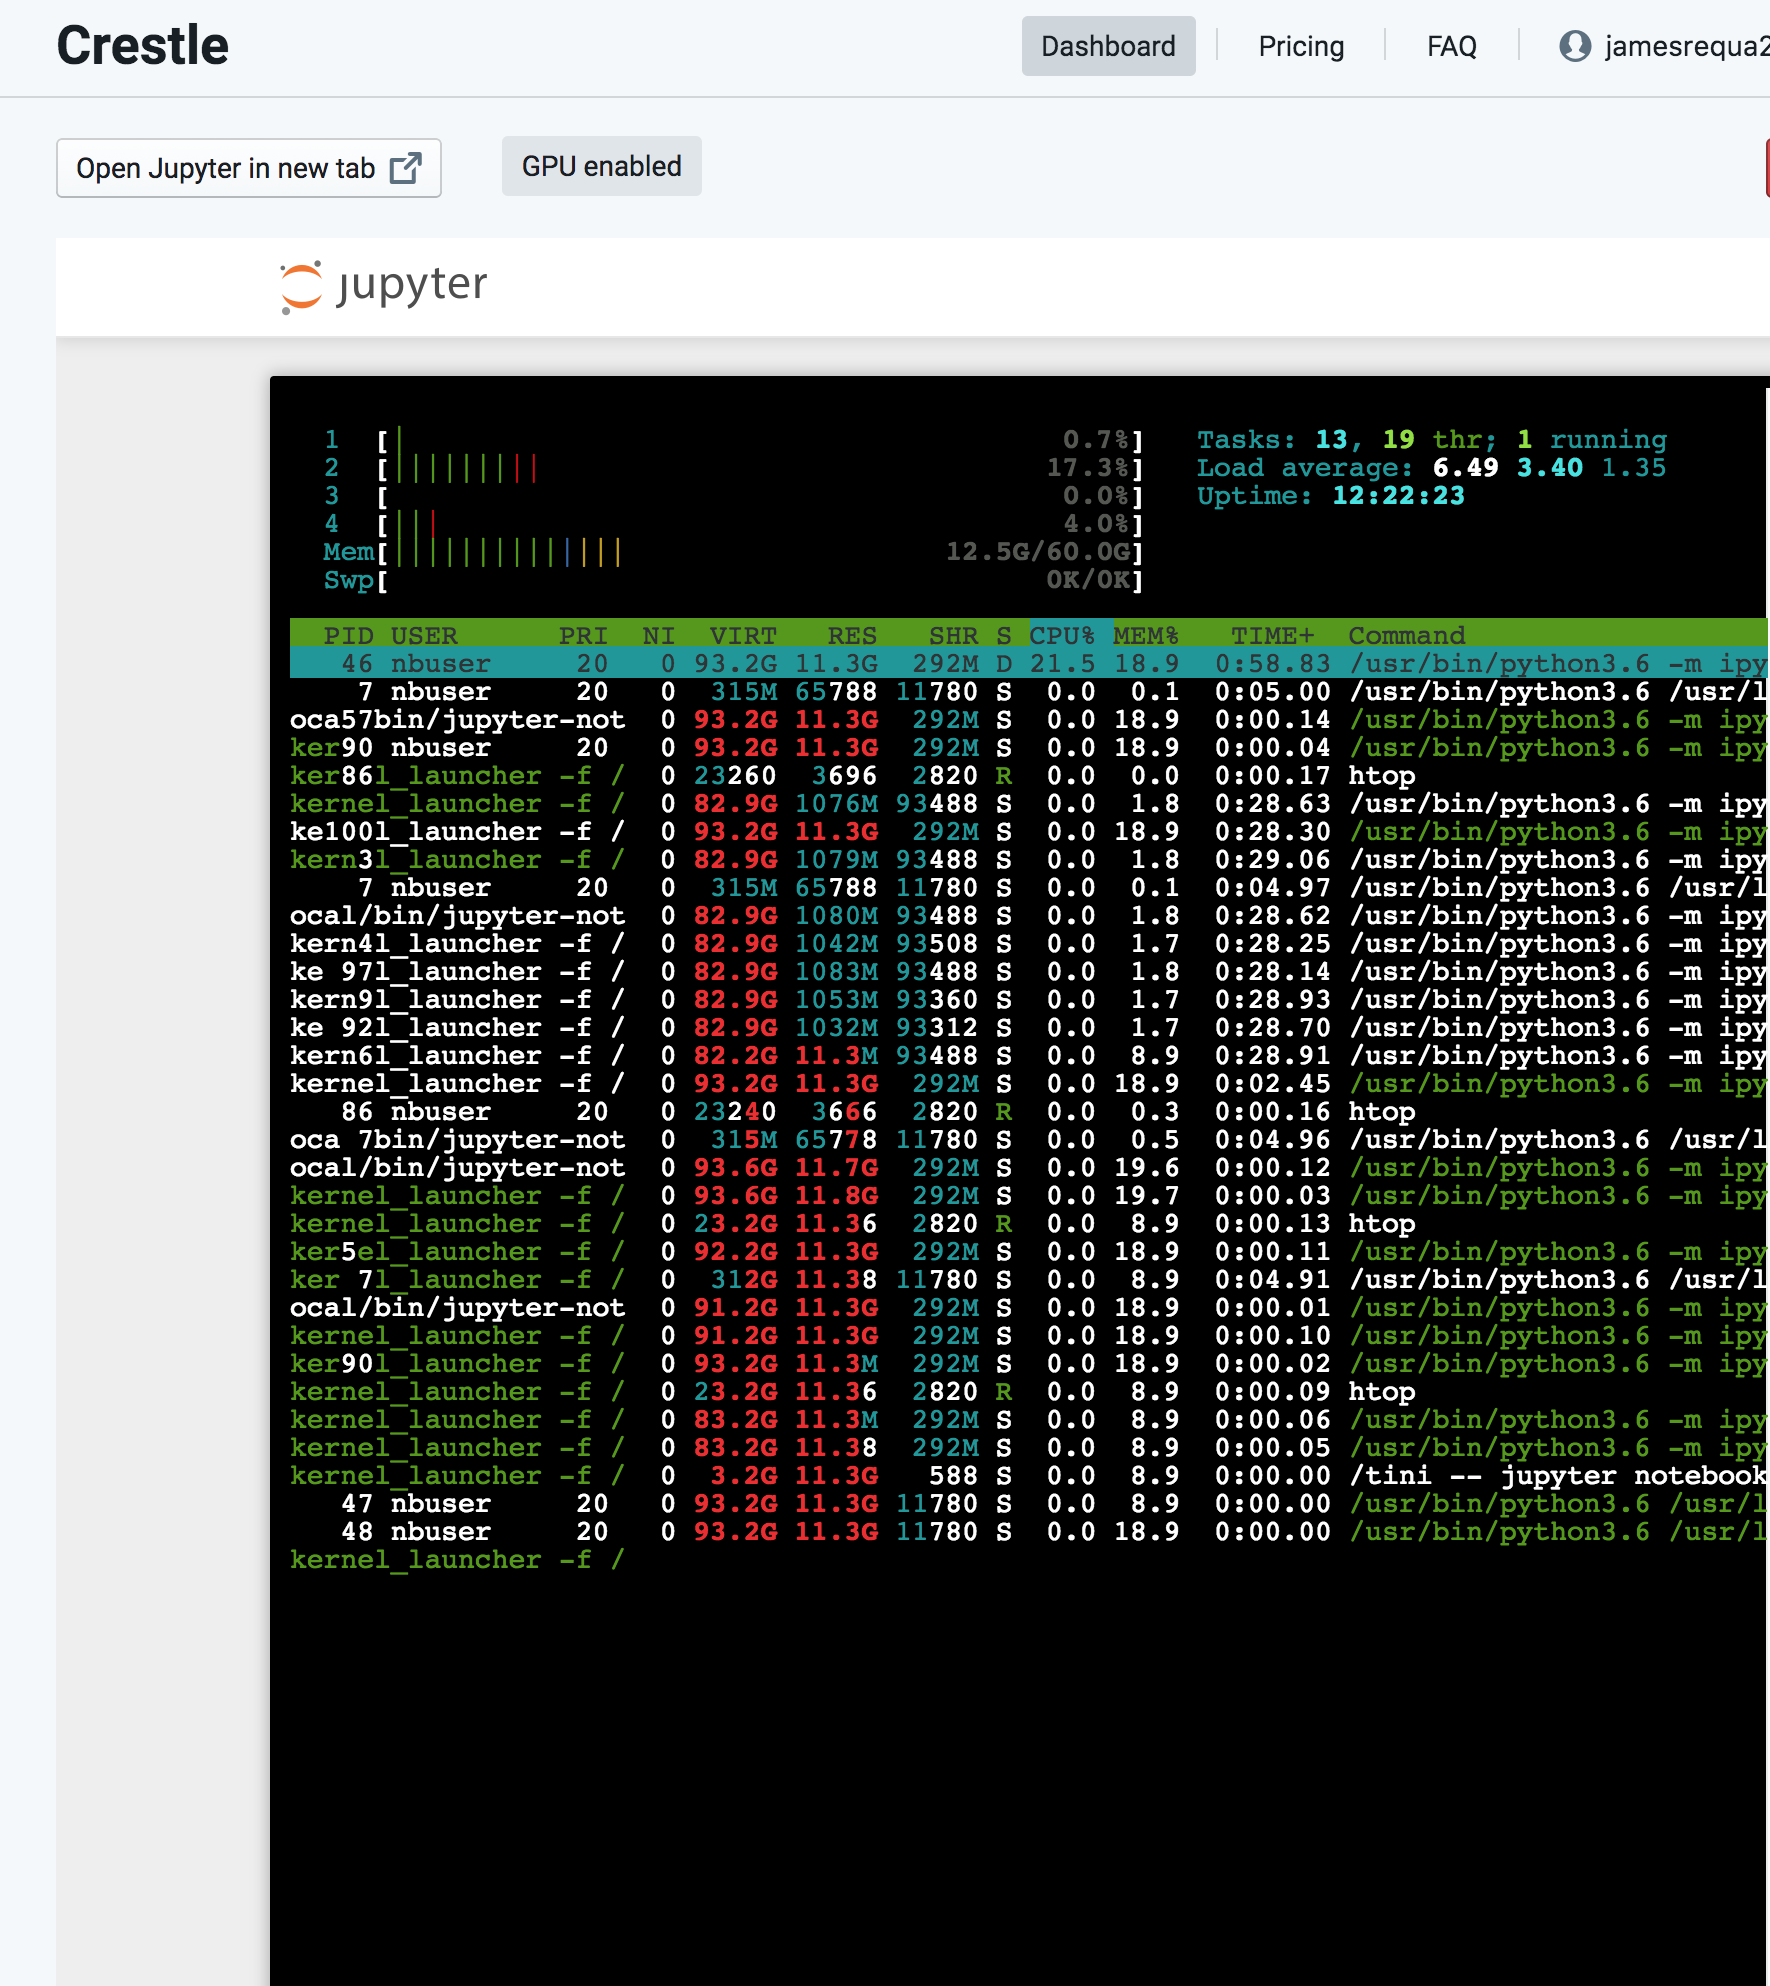
@ramesh that’s a good suggestion, I’ll try that. I actually did try running it with Crestle already but the repo didn’t look like it was updated there yet at the time so I didn’t test it.
OK I just tested on Crestle after doing a git pull and was able to run through the notebook but I did see that during that process it needed 12.5GB of RAM to initially precompute activations (see attached screenshot of output from crestle terminal). But after that RAM usage goes back down to 3-4GB range for the rest of the notebook.
I also have the same issue on the latest code from master. What is really weird is even when I kill/shutdown the kernel and notebook something like 4gb of RAM remains used. Looks like a memory leak.
My rig:
32gb of RAM (but there was ~14gb free when I ran the notebook)
i7 7700k
GTX 1080Ti
Ubuntu 16.04