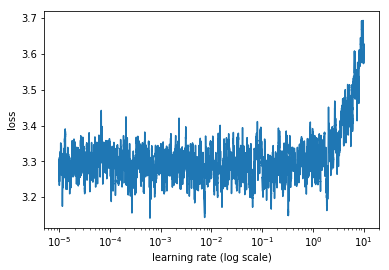
So after running the LRF (v1) on a wiki103 dataset the results are “wiggly, wiggly, up”
Should I just guestimate one of the spots where it goes down, or zoom in by using LR boundaries (the run takes about 2.5h so I’d be happy not to rerun :P). Like maybe pick 0.008-ish or maybe 0.0008?
Where would you “zoom in”? My guess would be set one exponent decrease as the boundaries and see what it looks like, e.g. run the LRF with boundaries of say 1e-3 to 1e-2 (since the ULMFiT-paper recommended 0.004)?
What would the general interpretation of the graph be? My interpretation is…great news, loss somewhere in the 3.4 to 3.2 range should be possible…but it fluctuates a ton so…well…uhoh? I’d happily take 3.4 flat as that’s slightly below 30 perplexity which seems really good
FWIW I have also played with LRF2, what is the general recommendation for the limit? I picked about 1% of the epoch for quickchecks/playing around and 10% of my epoch (takes about 30 minutes) as a shortcut to running v1. Any recommendations here would also be welcome. Anything on interpreting LR graphs and experimenting with them is welcome. I think I kind of sort of understand what’s going on but have doubts
Results are wriggly because you barely have a divergence here (3.2 to 3.7 in loss is little in terms of variation) and sooooooo many points since you went over a full epoch. The goal of the LR Finder is to quickly find a good learning rate, but it’s not suitable for datasets so large (since as you said, one run takes 2.5 hours!)
I’d recommend using either the new training API to run a LR Finder for 0.01% of an epoch (or whatever makes 200 iterations, that’s plenty to have a nice graph), tutorial can be found here, or to use LR_Finder2 that asks for a number of iterations (again 200 is a good choice).
Thanks, wasn’t aware of the new API. Looks pretty cool, basically mixing and matching the TrainingPhase any way one likes seems powerful
It’ll take some time until I have wrapped my head around when one wants which combination but the flexibility is awesome.
I tried a couple of runs with LR_Finder2 (I limited to 1000 but I’ll redo a couple with 200), I’ll post the screenshots when I get back to the machine tomorrow. The gist was that there were a couple of decent looking candidates. For example I did bounds of 1e-5 to 1 and rand 1k, then I did 1e-3 to 1e-2 etc. and most of them had a good downwards slope somewhere.
Maybe it’s a good exercise to post them and my thought process. I feel I don’t quite know what I’m doing when it comes to LR for huge datasets
Is running over an epoch a complete waste or is the graph meaningful in some way? My thought is that if I use a lot of data like this I get sort of a macro-view and in theory I can find interesting points to zoom in.
Thanks for sharing the link. I was curious, do we really need to define all these functions or have they already been implemented in the API? I think I tried yesterday to run use_clr with something like this (50, 15, 0.95, 0.85). The training started with no errors but not sure if that actually implements the 1cycle idea.
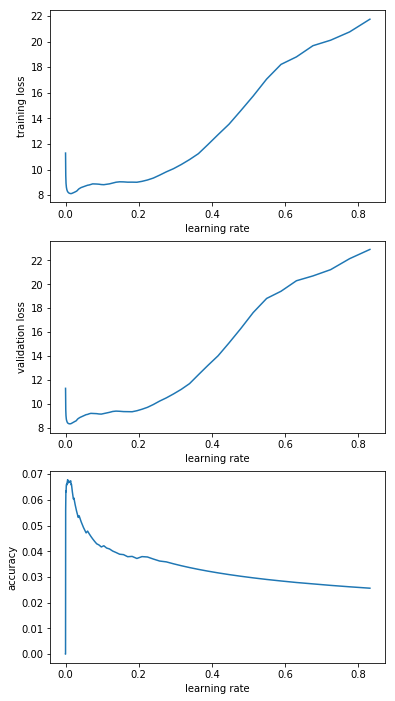
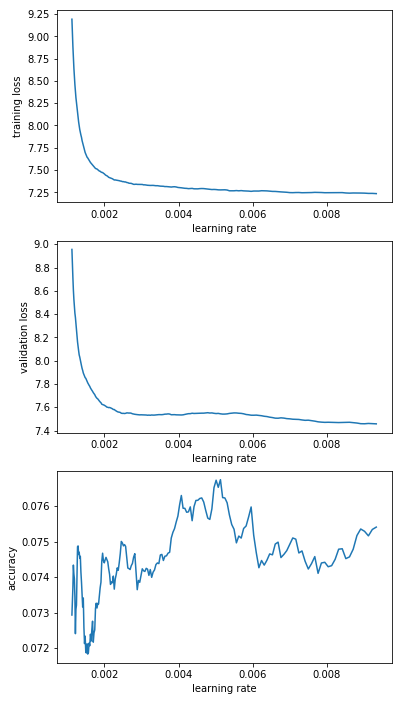
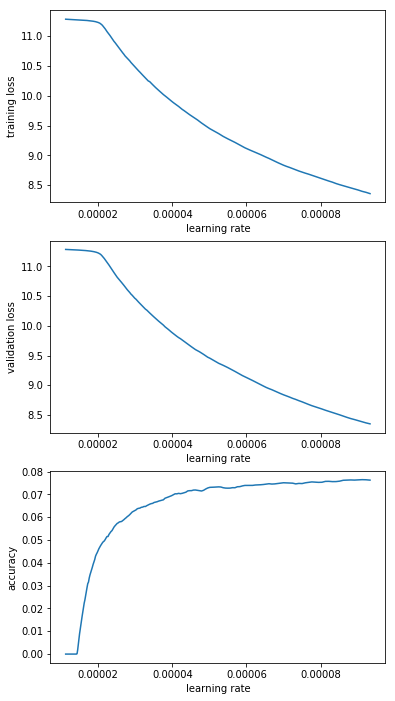
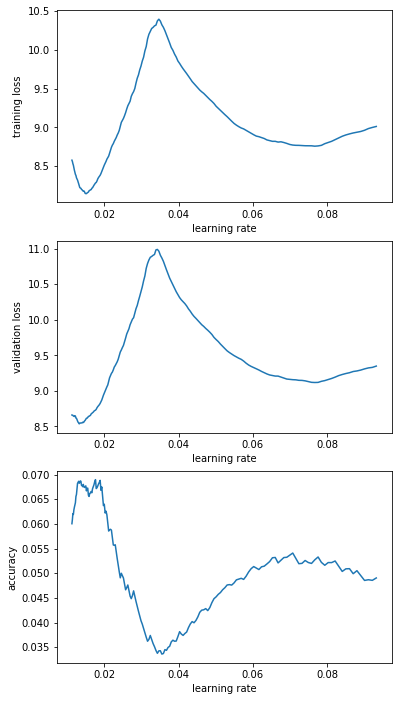
I interpreted that graph as “guess it’s LRs below 0.1 that I’m interested in” but decided to run 200 steps for “e-1_to_1e-0”; “e-2_to_1e-1”; “e-3_to_1e-2”; “1e-4_to_1e-3”; “1e-5_to_1e-4”. Here’s the resulting graphs:
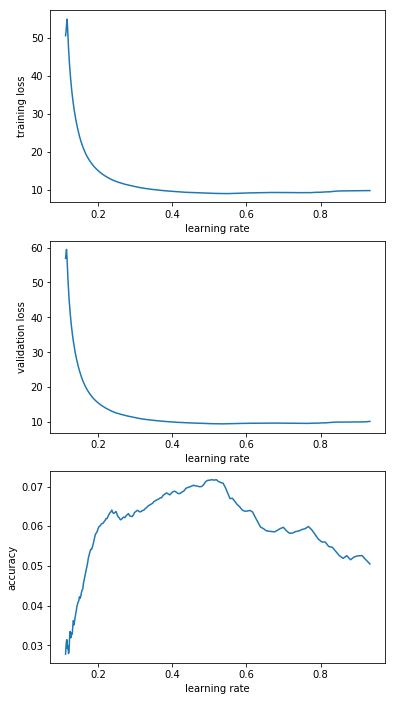
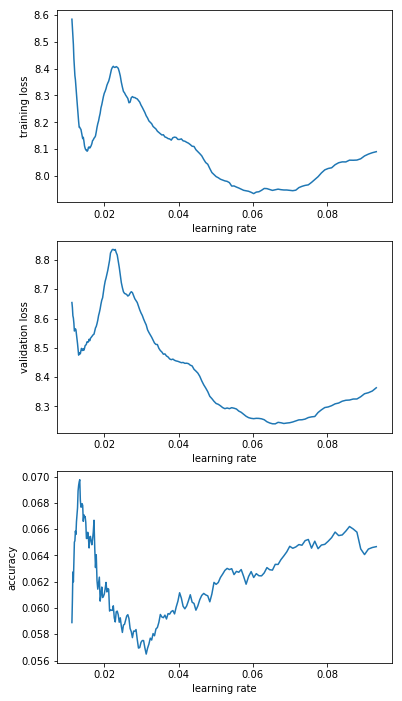
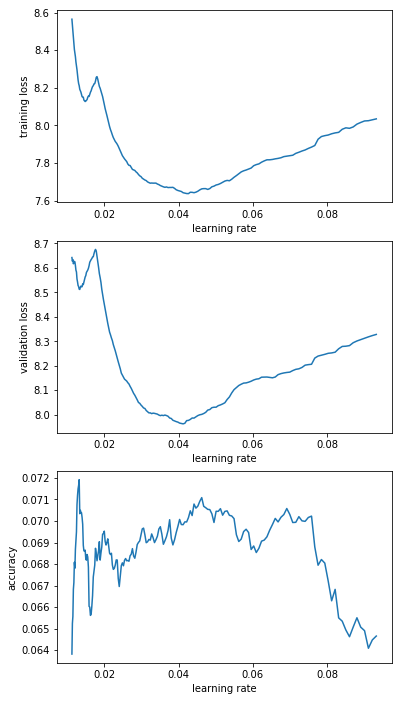
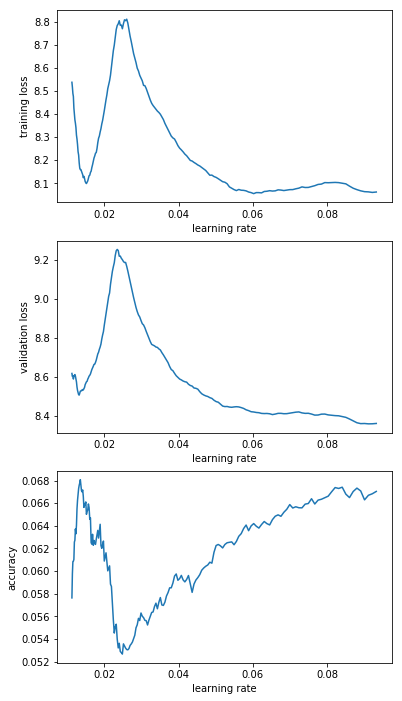
From that I decided that “e-2_to_1e-1” is the most promising range. So I decided to rerun this range a couple of times (I saved the model and reloaded it before every LR finder run). The results are below and have me a bit worried. Basically I’d have picked different learning rates for different runs.
The functions in the tutorial haven’t been defined in the fastai library, if that was your question (you can copy-paste as needed though). But they correspond to functions already there, just not implemented with the new Training API. I think the project will be to unify everything for fastai v1.
As for the 1cycle, it’s use_clr_beta you should use, and (50,15,0.95,0.85) doesn’t seem weird to me for an argument.
Yeah the first graph aren’t really helpful since I didn’t put an option to plot them with log scales (for such a range you need it).
For the following ones, remember that the LR Finder is there to give you the order of magnitude of your LR, it will never give you an exact value that’s best. By essence, when you go near the point of divergence, the training goes very shaky and depending on your luck (or lack of) you will diverge sooner sometimes. It’s the same during a real training if you use a high LR too close to the instability. Sometimes it goes wide, sometimes it stays contained.
My advice would be to plot the graphs of the wider range on a log scale, spot the minimum and go one order of magnitude under it.
It’s good to know about use_clr_beta, will make use of it. Although, funnily enough I used those options with use_clr and it still ‘worked’. I imagine it did the same thing as before only not showing an error for the options?
In any case, it doesn’t matter I will adjust my code as needed thanks.
No, use_clr is different. It expects a tuple of 2 elements so it just ignored the 0.95 and 0.85. Then it creates a cycle where the first argument is the ratio between the maximum learning rate and the minimum learning rate, and if the second one is n, you spend 1/n-th of the budget in epochs growing the lrs, the rest decreasing.