pip does not install graphviz executable, you should download it yourself from https://www.graphviz.org/download/ or use conda conda install -c anaconda graphviz
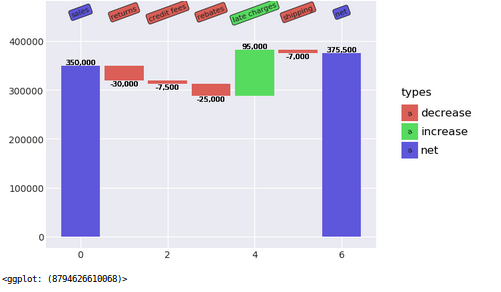
Here is an attempt at waterfall plots with plotnine the ipynb codes cells follow.
This is still a work in progress any comments welcome
%load_ext autoreload
%autoreload 2

%matplotlib inline

import numpy as np
import pandas as pd
import matplotlib.pyplot as plt
from plotnine import *

b0 = pd.DataFrame({'desc': ['sales','returns','credit fees','rebates','late charges','shipping'],
        'amount': [350000,-30000,-7500,-25000,95000,-7000]})

def comma(x):
    'The two args are the value '
    if len(x) >1:
        res = []
        for el in x:
            res.append("{:,.0f}".format(el))
    else:
        res = "{:,.0f}".format(x)

    return res


def waterfall_df(balance):
    """
    Expects a two column named 'amount' and  'desc' data frame
    """
    balance.desc = pd.Categorical(balance.desc, categories=balance.desc)
    balance['types'] = ["increase" if v > 0 else "decrease" for v in balance.amount]
    total =  balance.amount.sum()
    balance = balance.append({'amount':total, 'desc':'net', 'types':'net'} , ignore_index=True)
    balance  = pd.concat([balance,pd.Series([v for v in range(balance.shape[0])])], axis=1 )
    cols = balance.columns.values
    cols[-1] = 'ind'

    #print(cols, type(cols), balance.types.unique())
    balance.columns = cols
    #print(balance.amount.cumsum())
    balance.types = pd.Categorical(balance.types, categories=['decrease', 'increase', 'net']) #balance.types.unique())
    balance.iloc[0, len(cols) -2] = "net"
    csum = balance.amount.cumsum()
    zero_s = pd.Series([0.0],index=[len(csum)-1])

    balance['end'] = csum[0:len(csum)-1].append(zero_s)
    balance['start'] = csum[0:len(csum)].shift(1).fillna(0)
    cmap = [ '#d83000' if v < 0 else '#242b73' for v in balance['amount']]
    balance['cmap'] = cmap

    return  balance

def waterfall_plot(balance):
    ind = balance.ind.values
    end = balance.end.values
    start = balance.start.values
    end_lbl = comma(end)
    start_lbl = comma(start)
    nudge_end = [1 if e < s else -0.3 for e, s in zip(end,start)]
    nudge_start = [-0.3 if e < s else 1 for e, s in zip(end,start)]
    black = '#222222'
    y_min = balance.end.values.min()
    y_max = balance.end.values.max() + (0.2 * balance.end.values.max())

    p1 = (ggplot(balance, aes('ind', fill = 'types')) +
          geom_rect(aes(x = 'ind',xmin = ind - 0.45, xmax = ind + 0.45, ymin = end,ymax = start)) +
          xlab("") +
          ylab("") +
          theme_seaborn() ) #+
          #theme(
          #    axis_text = element_text(balance.desc, color='#555555', size=8, angle=45, va='bottom', margin={'t':10,'b':10})))
          #    axis_text_x=element_text(color=black)))
    for s, e, i, t , a in zip(balance.start, balance.end, balance.ind, balance.types, balance.amount):
        if t == 'increase' :
            p1 = p1 + geom_text(
                            aes(x=i,y=e, label = a, nudge_y = 1), va='bottom', size = 8,format_string="{:,.0f}")
        elif (t=='net') & (e > 0):
            p1 = p1 + geom_text(
                            aes(x=i,y=e,label = a, nudge_y=nudge_end[0] ),  va='bottom',  size = 8, format_string="{:,.0f}")
        elif (t=='net') & (s > 0):
            p1 = p1 + geom_text(
                            aes(x=i,y=s, label = a, nudge_y = nudge_start[len(nudge_start)-1]),
                            va='bottom', size = 8,format_string="{:,.0f}")

        elif t=='decrease':
            p1 = p1 + geom_text(
                            aes(x=i,y=e, label = a, nudge_y = -0.3),  va='top', size = 8,format_string="{:,.0f}")

    p1 = p1 + geom_label(aes(y=y_max,label='desc'), color=black, size=8, angle=20, va='center')
    #p1 = p1 + scale_fill_manual(values = [('decrease', "indianred"),('increase' ,"forestgreen"), ('net', "dodgerblue2")])
    return p1

waterfall_plot(waterfall_df(b0))
try it on your data
2 Likes
Are these videos enough to say we can start working on Machine Learning Models in real world ? Cna you please help me on it .
Sir , cannot thank you enough 
we could each create an initial model and crosscheck to see what we can learn from each other
should we choose a different dataset as houseprices has only 1461 samples for training ?
you could also email me at my username @ hotmail.com
sure …
Do you have any suggestions regarding a different dataset
Hi all, i tried building an image classifier based on lesson 1 of part 1.
I wrote my first medium post based on the results i had, please check it out and let me know your thoughts
I am getting an error that the kernel died when i execute the below code in lesson1 . Cna anyone please help me .
df, y, nas = proc_df(df_raw, ‘SalePrice’)
Can anyone help me with GBM and XGBOOST ?
Any lecture series or youtube videos ?
I had presented the “Ethics and Data Science” materials to my research group today, a 30 people data visualization group at HKUST! It was an underdiscussed issue, but not anymore! Thank you, @jeremy and @rachel !
Here is my slides, copied and annotated the original course slides on Github.
2 Likes
Hi,
In lesson4-mnist_sgd, I’m facing the below issue
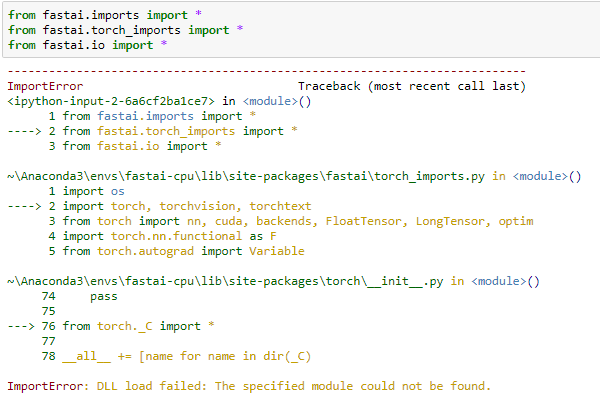
Can anyone help me?
The earlier post was messed up with the reply to @sashank’s post !!
Thanks,
Sumit
Hi, people. Can someone help me on lesson 2 ? [Workbook 1]
I got this when running :
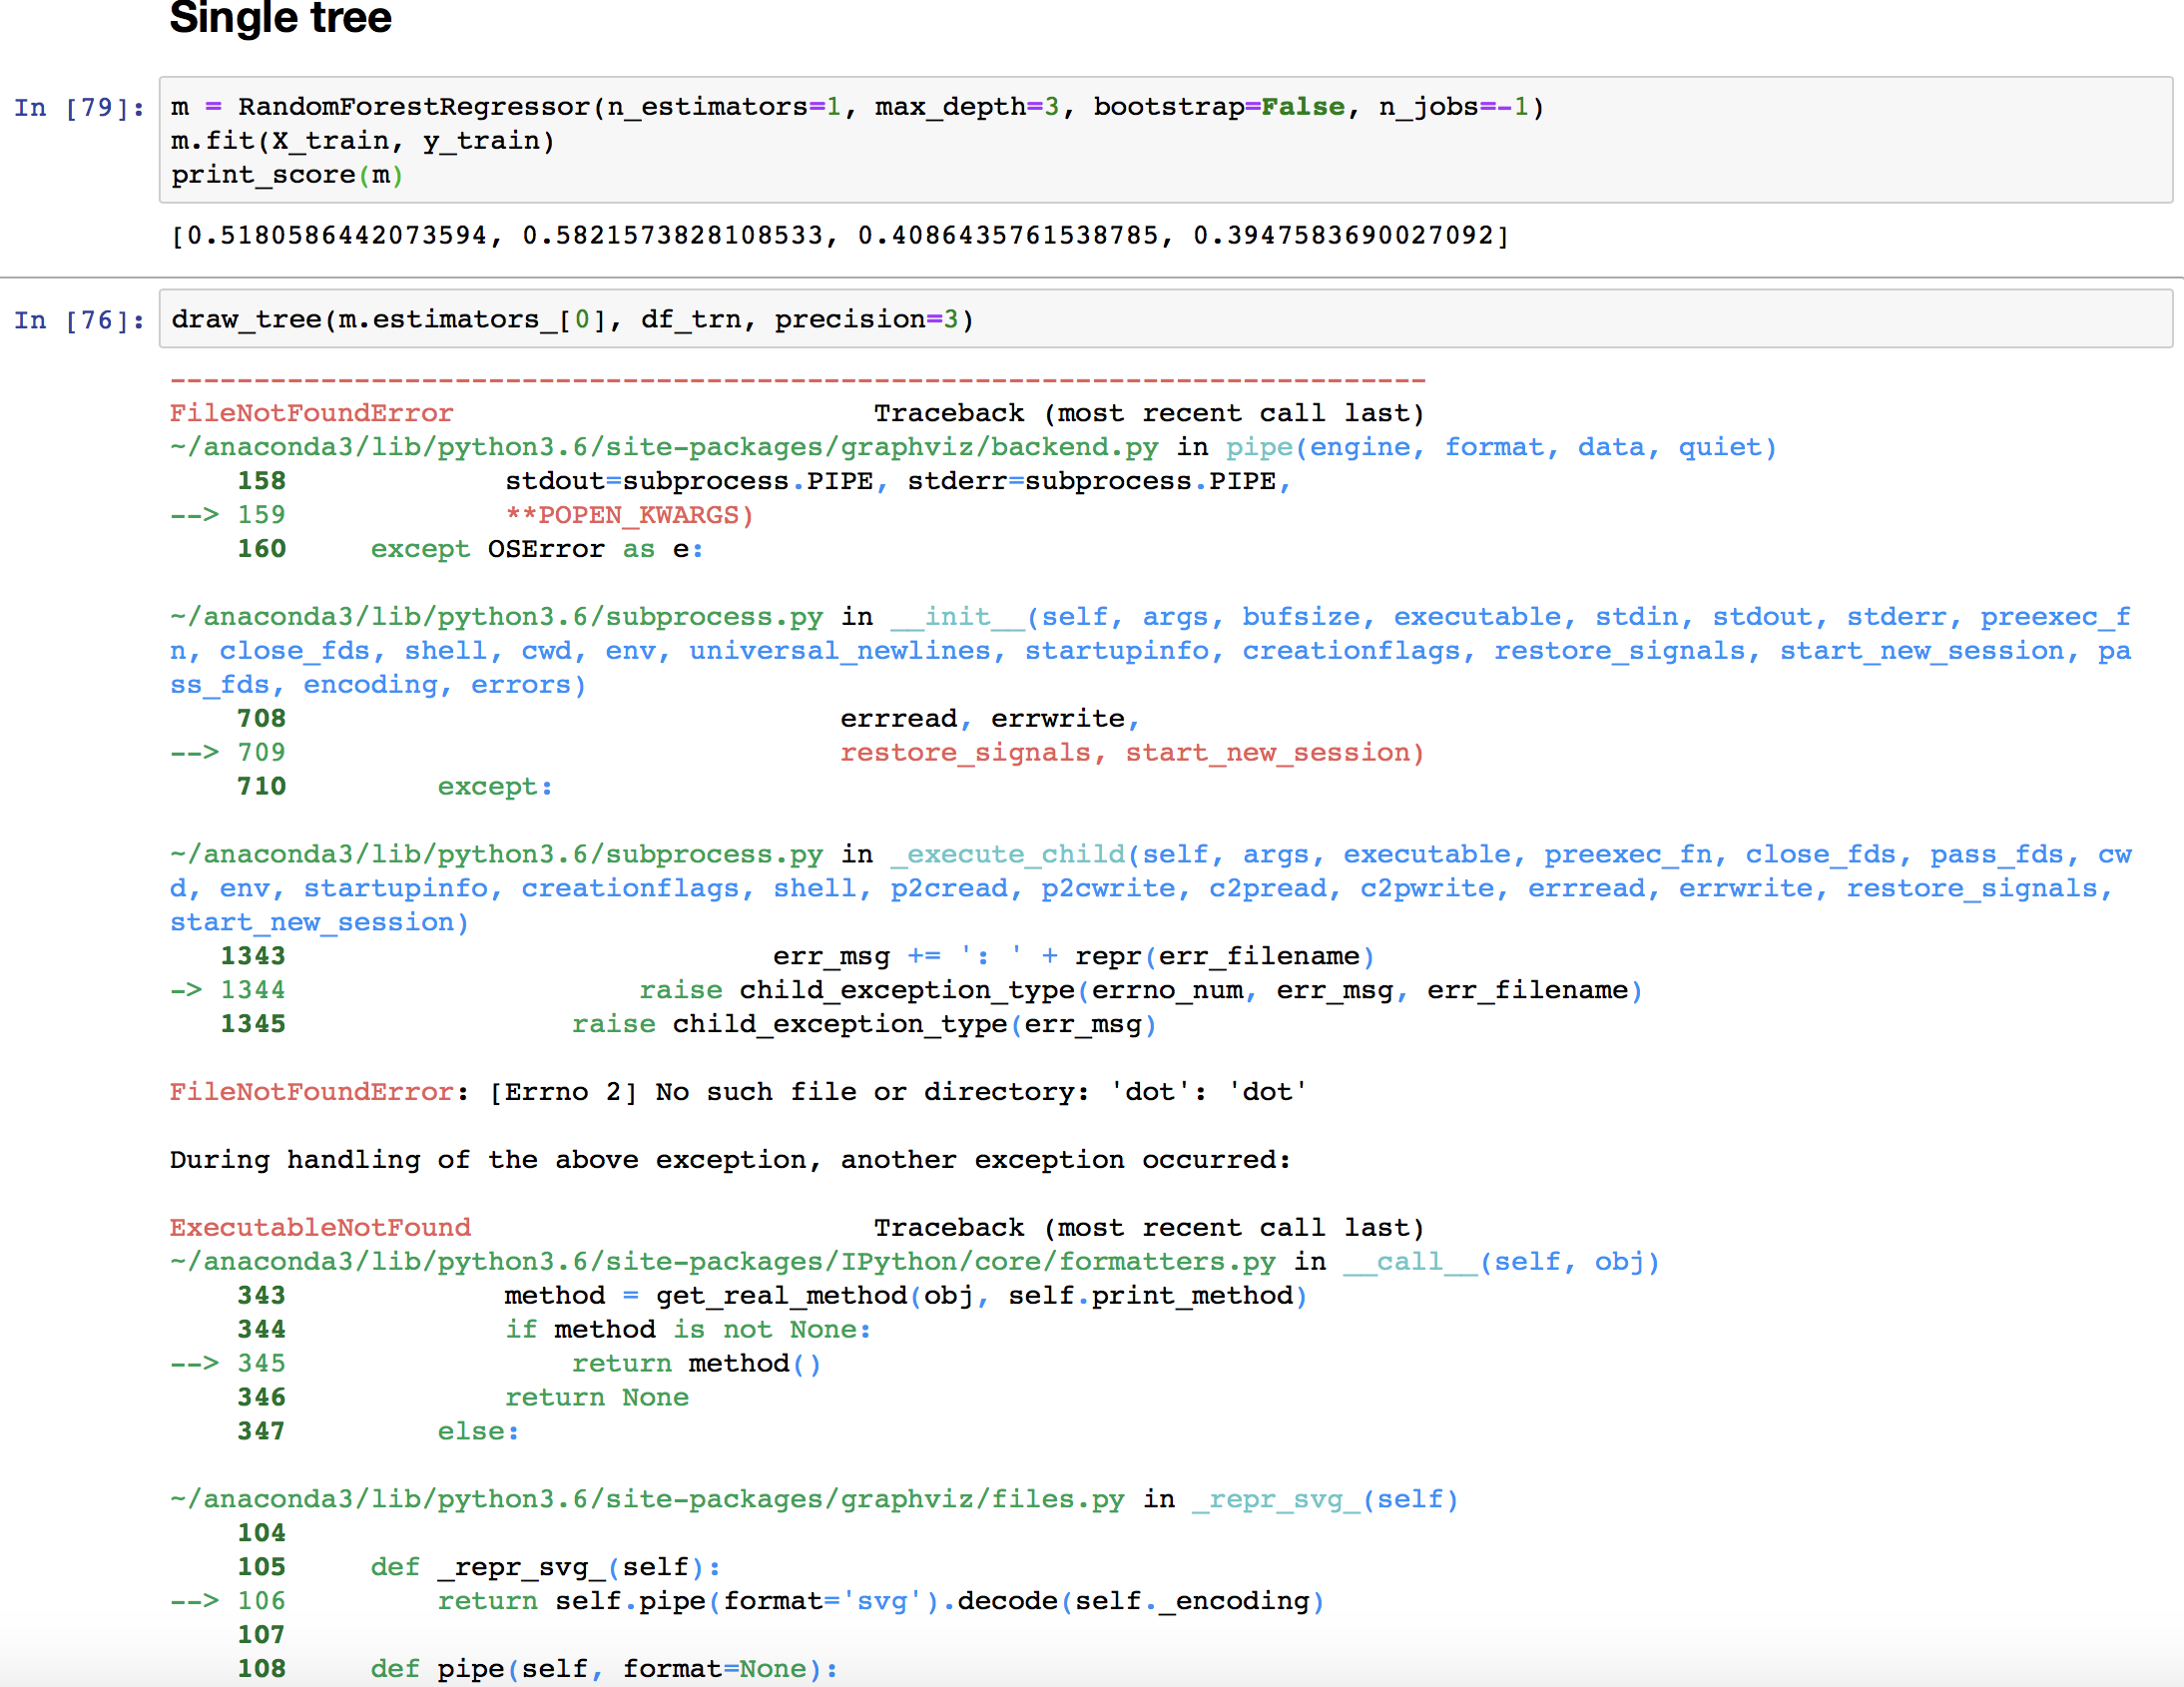
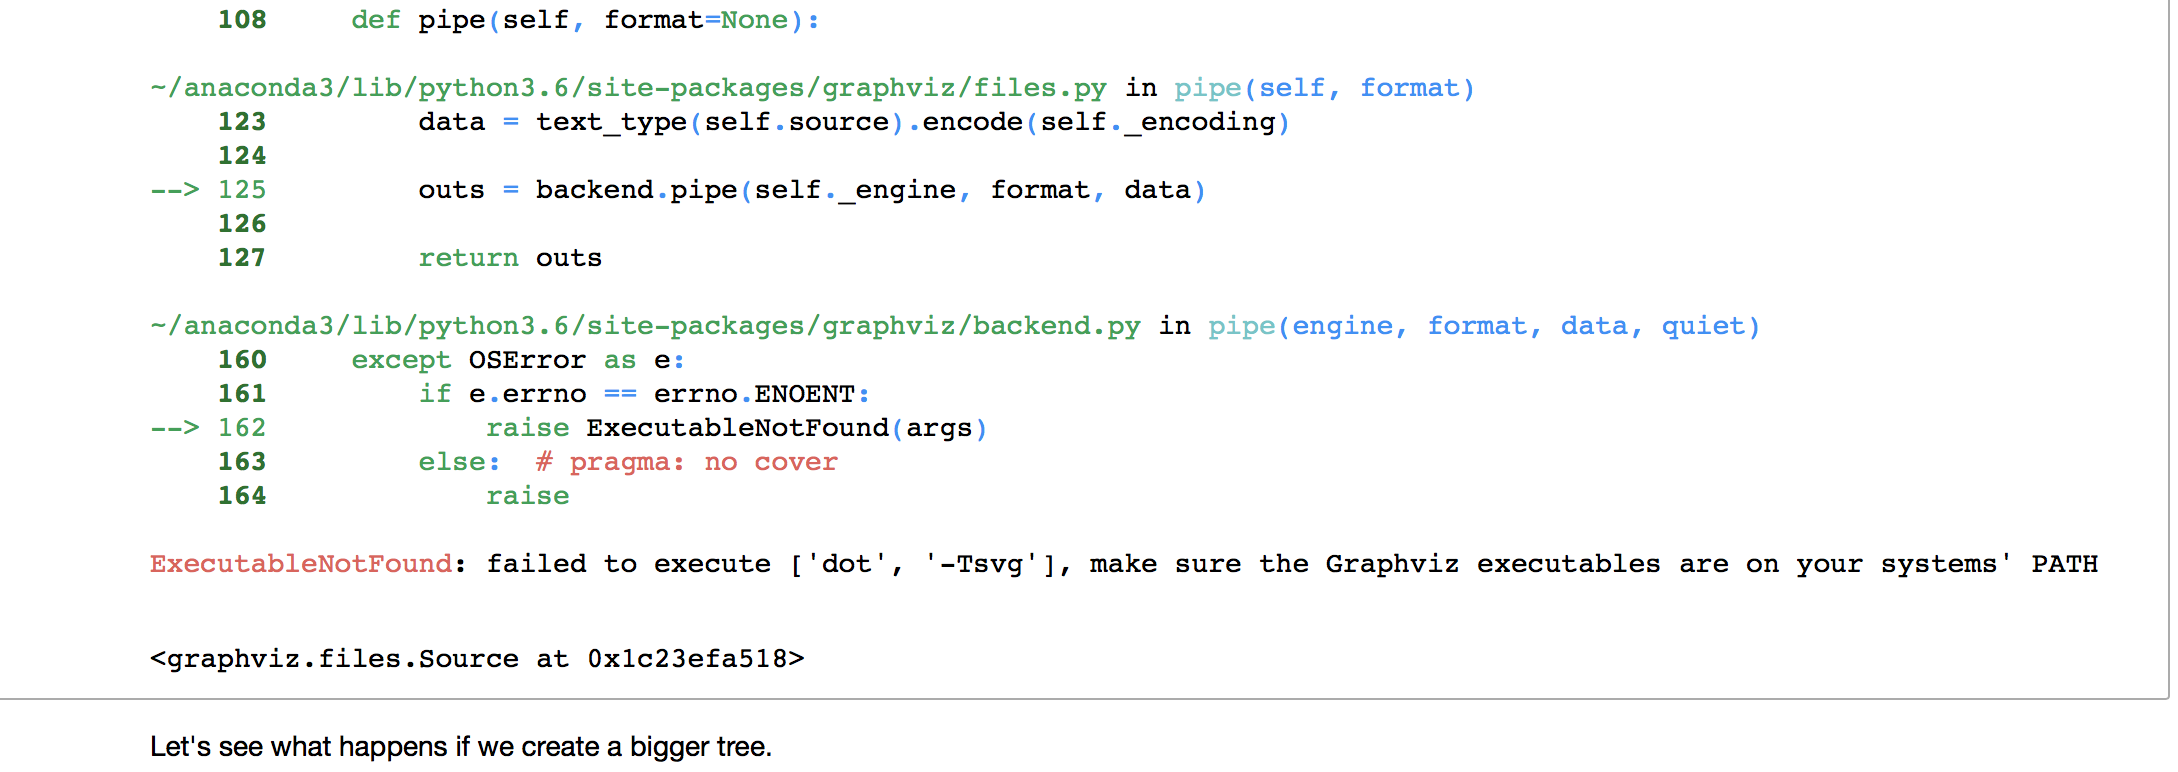
Please run this conda install -c anaconda graphviz .
Let me know if it doesn’t work.
1 Like
I’m facing the same issue but couldn’t able to solve it.
After looking into forums i ran this conda install -c defaults intel-openmp -f but nothing happend & also i don’t know what’s the significance of it.
Have you solved it? Can you please help me.
Thanks,
Sumit
yes , its the same … I later realized that feature logic is not working in my system now sure why .
Can you tell what’s the shape of df and y?
& what’s showing after you run proc_df , I mean any error or anything which will be helpful to figure what’s wrong ?
and also if at all df & y has values then can you post first 4-5 rows in here .
Thanks,
Sumit