df_trn, y_trn, nas = proc_df(df_raw, ‘SalesPrice’)
This should do the trick Jeremy will explain this another video about what this option, but this was fixed in an update.
df_trn, y_trn, nas = proc_df(df_raw, ‘SalesPrice’)
This should do the trick Jeremy will explain this another video about what this option, but this was fixed in an update.
I am trying to apply RandomForestRegression to a dataset which has unsorted and Null dates in training as well as test data. I suspect this is causing the severe drop in my validation score. Can anyone guide me how to handle such scenarios?
P.S. Pardon me if this has been taught in future lessons, I’ve just watched the first two lectures.
Why is that we have only 14 splits. If the data cannot be split into two roughly equal halves, then we may have more that 14 splits for 20K samples.
If we are looking for the upper bound on the splits, worst case we may end up with 20K-1 splits. It’s not clear to me on why we use log2(samples) for the splits.
Fill missing values with fillna using median values for quantitative columns, for categorical cols missing vals are interpreted as -1 (0). There is a utility method proc_df that does this.
That is a good point! Thinking about equal sized splits helped me build intuition about how constructing a tree works, but you are absolutely right that this is neither precise nor correct.
In practice I think we are much more likely to see a number of splits closer to the lower bound than the upper of 20k-1. We probably do not want to have leaves of size 1 (this can be configured) due to overfitting. Also I am under the impression that the methods used for calculating value of splits will favor splitting into two splits of similar size vs one large and one small (the gini index and the information gain are both summation based). Not sure if this is correct though?
Anyhow, I started learning about trees from the point of completely not understanding how they worked to where now I hope I have some semi useful and correct intuition - really appreciate you chiming in @tutysara as this is definitely helps to refine my understanding!
Why are we worrying about the splits?
Because if I remember the tree diagram, the tree splits the data according to the feature Importance and other parameters…
Also as radek and you said earlier, we can have a path to the individual leaves in the worst case…(that’s bounded by the data size)
But we don’t want to do so…
We want the RF to split the data accordingly which might be sufficient for it to generalize eventually.
Please shed some more light into the ongoing discussion…
Thanks…
I am also on my learning journey and reading through the comments really helped understanding the points better and checking my understanding, thanks @radek for the writeups.
I was talking about the worst case scenario, since I was thinking it as the upper time bound on running the algorithm (asymptotic analysis). Your reply clarified this – its the most probable scenario we are talking about and not the worst case scenario. I guess we are on the same page, ty.
@ecdrid did it answered your question too? if not we can discuss more on this
tim thanks for these.
I loaded up lecture 11 on jeremy’s list and it fit the lecture 12 here
I found reading through the whole lecture first help me understand better. As I have some misunderstanding on Regularization on Logistic Model.
When Regularization is LARGE, weight are suppressed to 0, while regularization is small, weight are allowed to float freely from what the loss function determines.
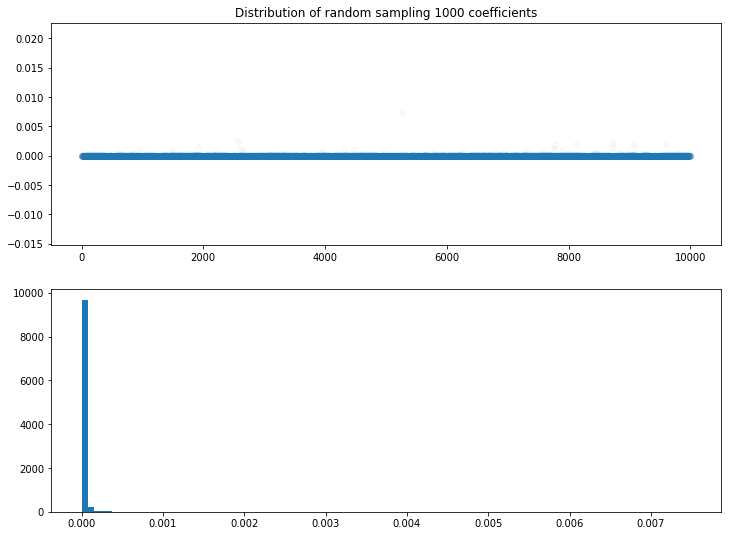
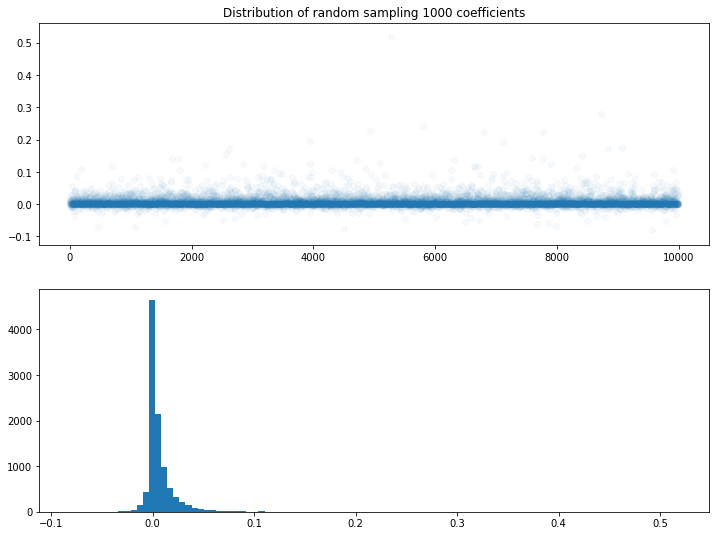
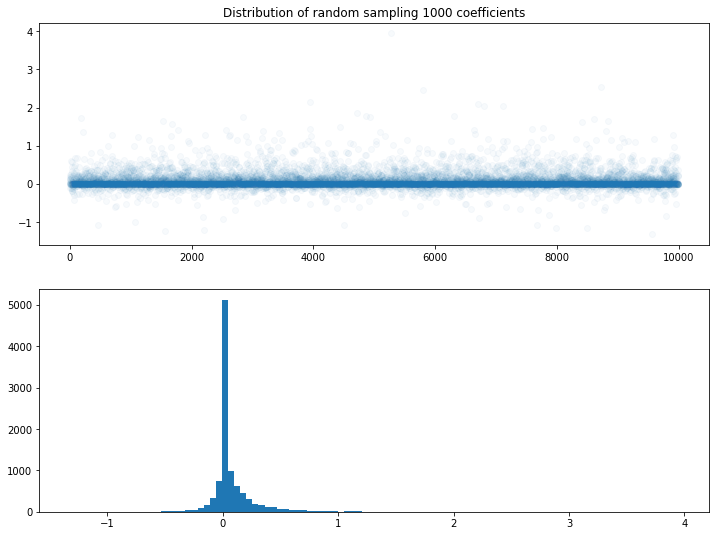
I find plotting the weight of coefficients help me understand better. I randomly sample 1000 coefficient in the logistic model and plot some scatter plots and histogram. In general, reducing regularization increase the range and stand deviation of coefficients.
C = 1e-5 (Strong regularization) ,weights are suppressed to 0
C = 1e-1 (medium regularization) ,weight ranges from [-0.1 0.1]
C = 1e 10 (Weak Regularization), weights can go very high (y,axis, up to 4)
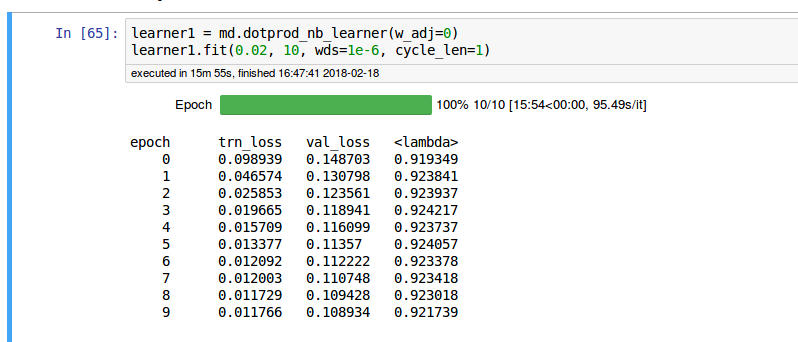
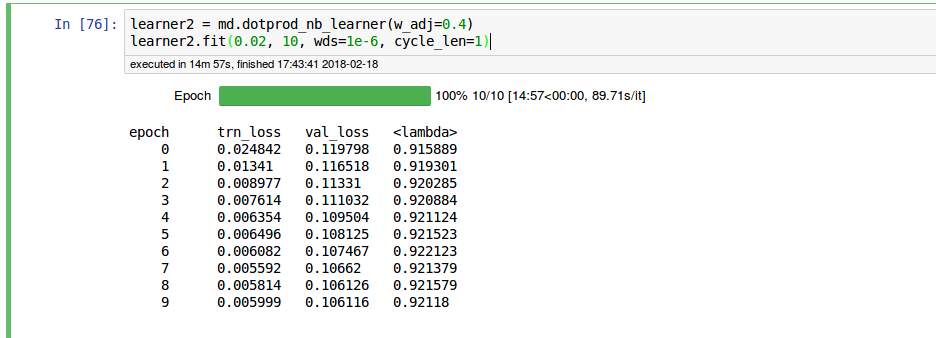
Now for the NVSVM++ part
I played around with the w_adj paramters, and I am surprised that w_adj = 0 performs better than the default setting w_adj = 0.4.
Gist: https://gist.github.com/noklam/834c5c774e72799d095bdcb343e8cf14
Just figured out the colors of rectangles when we used to plot the Rf trees has a symbolic meaning(Jeremy had said that it meant something but left it for us to figure it out eventualy)
Try
~$ conda install graphviz
There is this independently organised ML competition at my workplace in which I have to predict prices. The training and test data contain overlapping dates (also missing dates). This may not be a correct way to formulate an ML problem but it is what it is. Is there a way to deal with this and still create a representable validation set which generalizes well? Tips or tricks?
I was going to test NBSVM on Kaggle Toxic comment competition and found out there is already a Kernel on it.  Did you also try NBSVM++? I am thinking to give it a try.
No - it would be an interesting exercise.
I stuck with Kaggle Kernel today, cannot import Pytorch on Kaggle Kernel today. Will copy over to Paperspace tomorrow and try.
ImportError: dlopen: cannot load any more object with static TLS
It’s because PyTorch is broken on the Kaggle’s Docker image…
Nothing to do with fast.ai
To see it yourself,
Just fire up a kernel and do
import torch
I tried installing with conda and ran into a (rather odd) conflict with pygpu.
pip install treeinterpreter
worked
I see, any temporary fix that works? I follow Github issue seems that it works before but is broken again.
I love the fast.ai courses and recognize that @jeremy optimizes for his iteration speed, but I would like to respectfully suggest that more explanatory variable names would be helpful in the long run for achieving the goal of making ML uncool.
Maybex, y, and even df are be okay (like i) because of how standard they are, but IMHO some of the other abbreviations are overly terse. For example, batch_size would be way more informative than bs; image_size or img_size would be more understandable than sz.
Yes, bs and sz are faster to type, and thus bring the iteration time down, but I suspect that your goals will be better reached by improving readability than by improving typing speed.
I would be willing to go through the code and make a PR with IMHO more understandable variable names.