In lesson 10 and 11, Jeremy talks about Naive Bayes and Logistic Regression. I am confusing why the difference lies into regularization. And I thought it was 2 different model, but somehow it is suggesting they are quite similar in nature? I am afraid I can’t quite get this part, can someone explain it more?
I’m happy to help here as best as I can - but this is far too interesting a question for me to spoil it by just giving you an answer; you’ll learn far more if you try to answer it yourself. Can you try going back over the video, pausing at each point where I work through the derivations, and see if you can replicate them yourself? If you get stuck, come back and tell us the first point where you get stuck (perhaps with a screen shot of the bit you don’t follow) and tell us your best understanding of what you’ve seen up to that point. Then we can try to unstick you and you can continue on the journey! I think it’ll be worth it! 
(This is a subtle but important issue, so it’ll take some time to work through, but that’ll be valuable time…)
2 Likes
Sorry for the Spoiler
The Naive Bayes is linear classifier using Bayes Theorem and strong independence condition among features…
Logistic regression is mainly used in cases where the output is boolean. Multi-class logistic regression can be used for outcomes with more than two values…
RE - PDP plots interpretation…
@Brad_S (sorry)
Sorry for the delay,
here’s my notebook with plots…(scroll a bit down to RF Section…) (it’s a bit long…)
Thanks in Advance…
Idea of combining trees is to reduce variance. The forest as a whole has less variance.
Ok, I could’ve answered the query better if I’d focussed on this question… but I latched on to something else and missed something scrolling up and down our posts.
Here’s my suggestion which I hope will work for you and help your understanding. BUT I haven’t tried it.
where you call pdp.pdp_plot() add in an argument center=False
thorough info on the library you’re using https://github.com/SauceCat/PDPbox/blob/master/parameter.md
and the ICE plots https://arxiv.org/pdf/1309.6392.pdf
1 Like
OK… so let me try to explain what I understand from the lecture, please point out if I have some misunderstanding.
So from lecture 10 to lecture 11, we talk about Naive Bayes and Logistic Regression.
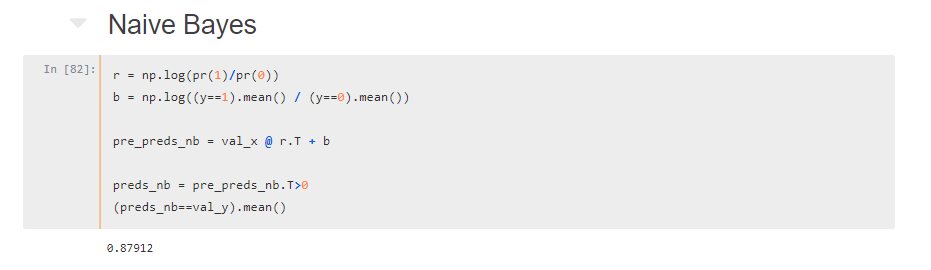
1. We first talk about Naive Bayes
pre_preds = val_term_doc @ r.T + b
2. We then used logistic regression to improve the accuracy as this is a more data-driven approach. (Let the model find coefficient instead of using theoritical value)
3. We try to combine both model
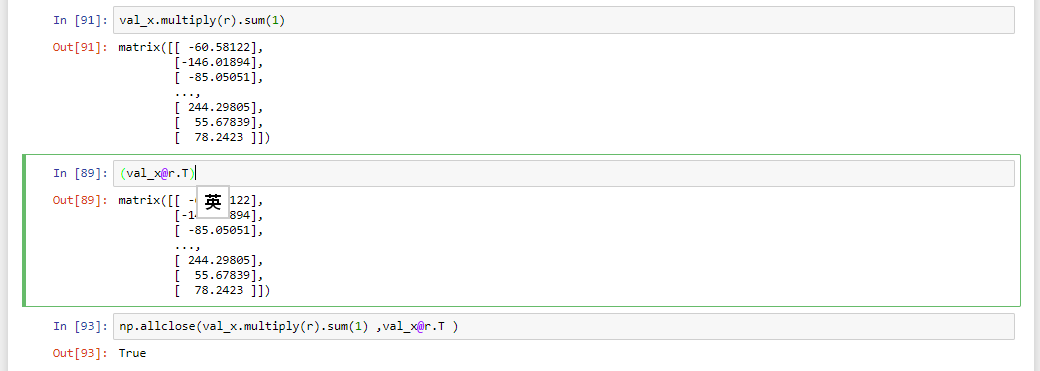
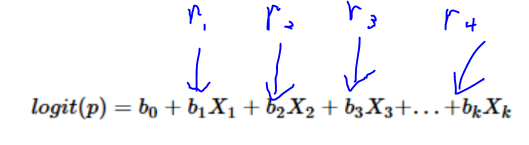
So when you talk about without regularization. Logistic Regression will be identical to Naive Bayes because we have multiply r (vector) to every word (x1,x2,x3…), which is identical to a dot product x1r1+x2r2+x2r3
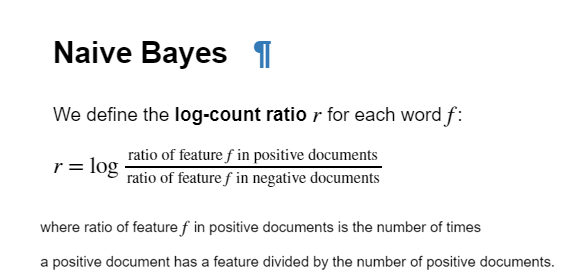
Equation of Naive Bayes:
pre_preds = val_term_doc @ r.T + b
Equation of Logsitic Regression
However, I expect when I increase regularization (decrease C), I should get similar result between Naive Bayes vs Logistic Regression. Did I do something wrong here? Sorry for making this long, as I couldn’t explain it in a simple way.
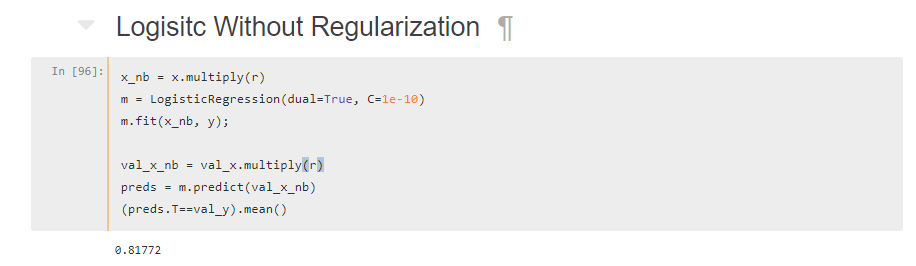
Gist: https://gist.github.com/noklam/834c5c774e72799d095bdcb343e8cf14
What should be done in this case??(the target values are very highly imbalanced
Countplot on the Target Values
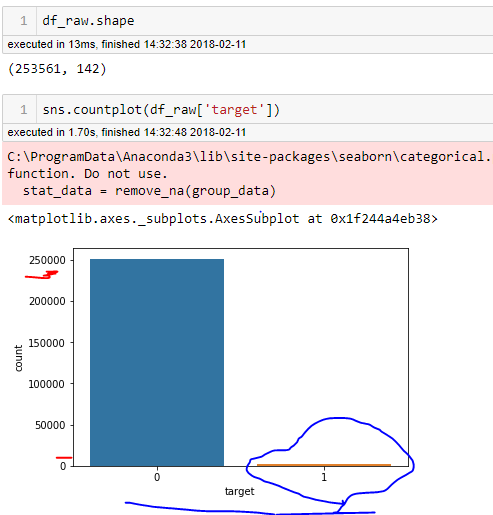
It’s a Kaggle In-class Competition
The problem is that Standard classifier algorithms like Decision Tree and Logistic Regression etc have a bias towards classes which have number of instances. They tend to only predict the majority class data, then there is a high probability of missclassification of the minority class as compared to the majority class…
Should i go for ensemble of different models on different data-sets or Boosting?
@Brad_S
1 Like
If you are using RandomForest. Maybe you can try to oversample the class until the distribution is balance? (I remember Jeremy have kind of talk about this trick, but I haven’t used it before)
1 Like
I guess (not sure) it won’t help per se because for RF it’s still the same thing(single copy or multiple copies…)?
First of all thanks for this series Jeremy. It’s pretty excellent. I have a doubt in the second lecture, that I hope someone can help me with.
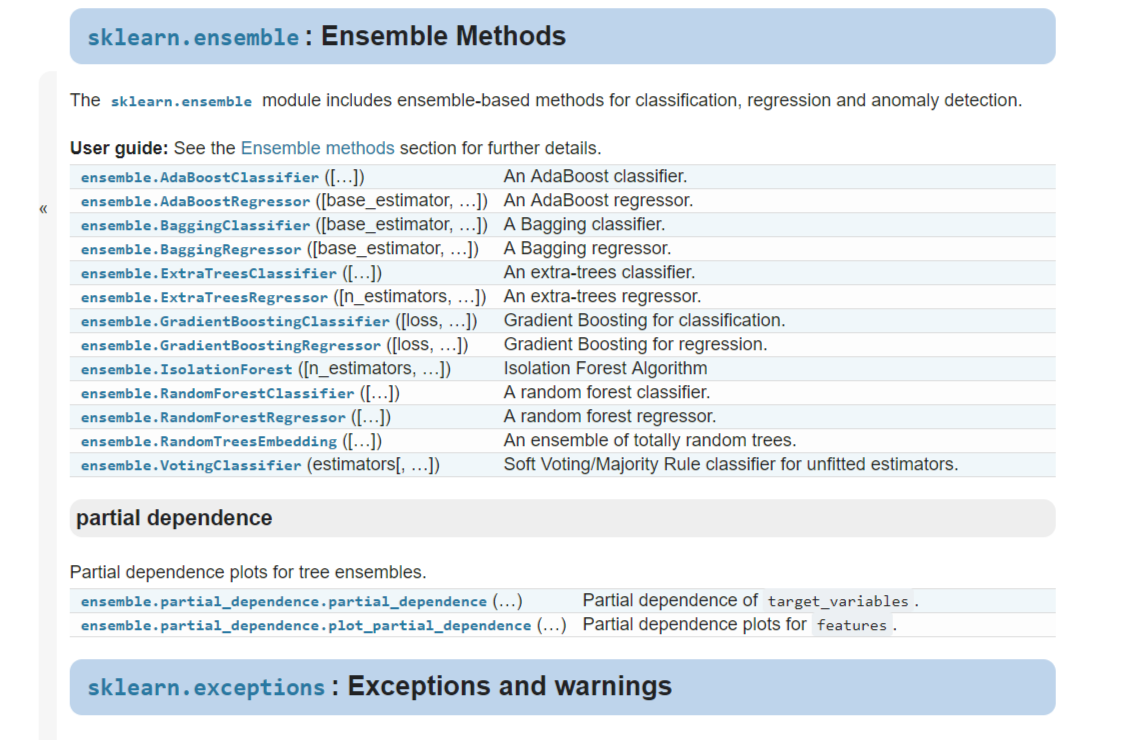
In the fastai library, in the structured.py file there is this line on the starting imports bit
from sklearn.ensemble import forest
I’m looking in the sklearn API but I’m unable to find forest.
Someone please help me with this. All I am able to understand here is that set_rf_samples changes something in the API itself, and I’d like to understand how this works and if it’s something we can use with other algorithms like SVM?
Hi, also in the second lesson, while executing the cell:
draw_tree(m.estimators_[0], df_trn, precision = 3)
I get the following error:
failed to execute ['dot', '-Tsvg'],
make sure the Graphviz executables are on your systems' PATH
I thought maybe graphviz isn’t installed, but import graphviz works in my fastai environment. I’m running this code on my windows 10 laptop. Also, since the whole thing is installed in the fastai conda environment, I don’t know if I should be messing around in the PATH.
see envs\fastai\Lib\site-packages\sklearn\ensemble\forest.py for documentation (below) and what it imports.
“”"Forest of trees-based ensemble methods
Those methods include random forests and extremely randomized trees.
The module structure is the following:
The
BaseForestbase class implements a commonfitmethod for all
the estimators in the module. Thefitmethod of the baseForest
class calls thefitmethod of each sub-estimator on random samples
(with replacement, a.k.a. bootstrap) of the training set.The init of the sub-estimator is further delegated to the
BaseEnsembleconstructor.The
ForestClassifierandForestRegressorbase classes further
implement the prediction logic by computing an average of the predicted
outcomes of the sub-estimators.The
RandomForestClassifierandRandomForestRegressorderived
classes provide the user with concrete implementations of
the forest ensemble method using classical, deterministic
DecisionTreeClassifierandDecisionTreeRegressoras
sub-estimator implementations.The
ExtraTreesClassifierandExtraTreesRegressorderived
classes provide the user with concrete implementations of the
forest ensemble method using the extremely randomized trees
ExtraTreeClassifierandExtraTreeRegressoras
sub-estimator implementations.Single and multi-output problems are both handled.
2 Likes
I just came across TPOT: https://epistasislab.github.io/tpot/
It looks like it tries a bunch of machine learning techniques from scikit-learn and tries to identify the best approach for your problem, once you’ve prepared the data.
2 thoughts:
- if this included all the fastai tips and tricks: wow!
- even if it doesn’t include all the fastai tweaks. it would sound relatively simple to turn this into a validation set tester. i.e. take 5 or so different models from TPOT, with 5 different scores, predict the test set on those 5 and show the valid_scores vs test_scores graph as shown in an ML lecture
I’m still too beginner to know where this sits between brain fart and a good idea. Let me know!
3 Likes
Installing python-graphviz definitely worked.
conda install python-graphviz
to be specific. Thanks @Brad_S
Also, TPOT looks pretty cool though I’m also in no position to judge.
1 Like
Here is one other thing I haven’t been able to figure out:
In the speeding things up section, where you pick out a subset of 30,000 samples from the original set, and then the first 20,000 of those for training, my r^2 score on the original validation set is surprisingly ~0.76, compared to ~0.86 that Jamie gets in his lecture. I can’t explain why this is happening at all. The only possible thing I can think of is that I’ve somehow downloaded the wrong data, but I can’t see how.
Since the data isn’t in the github repo, I got it from the competition page here: https://www.kaggle.com/c/bluebook-for-bulldozers/data
I downloaded the Train.zip file which is ~7 MB in size.
And then once you get to the section on OOB score, that is computed to be ~0.85 which is along the lines of what is shown in the lecture.
Finally once we start subsampling, things return to normal and the calculated r^2 scores are in line with what is seen in the lecture.
This doesn’t feel like it’s a major problem, since we will be using subsampling anyway, but I was wondering if this happened to anyone else and what is causing this.
Find my notebook Here: https://github.com/keshav-c/bulldozers/blob/master/lesson1-rf.ipynb
Edit: I was a bit too impatient here. The problem is addressed in the second half of lecture 3.
Hi all, I came across this article on “Towards Data Science” platform which is titled as “Machine Learning Zero-to-Hero: Everything you need in order to compete on Kaggle for the first time, step-by-step![1]”. This is definitely a good read. Yes Jeremy also covers this topic. I firmly believe that you’ll find this extremely useful.
[1] https://towardsdatascience.com/machine-learning-zero-to-hero-everything-you-need-in-order-to-compete-on-kaggle-for-the-first-time-18644e701cf1
1 Like
If by ‘Jeremy also covers this topic’ you mean ‘I learned most of what I know from Jeremy’ then yes, correct 
Other than that, thanks a lot for the positive feedback!!
2 Likes
@orendar it’s a great article! FYI I went to share it on twitter, but because your twitter handle isn’t in your medium profile, it didn’t credit you properly. You may want to add it.