So how are we getting those -ve lines in the PDP plots?
(Any justification)
So how are we getting those -ve lines in the PDP plots?
(Any justification)
Sorry, I have no clue what it is that you linked to. I remember seeing this graph in the ML lectures but don’t recall what it was used for.
The way random forests work is you present them training examples and a target variable - they will not work otherwise (they use the target variables during training, the splitting of branches).
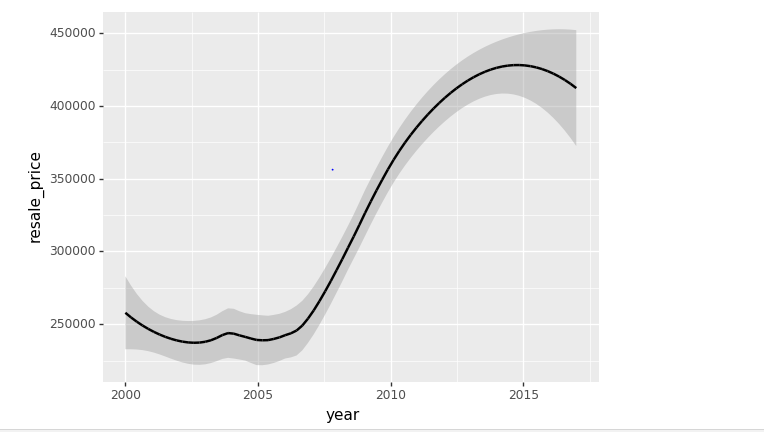
I got this diagram on a different dataset
Sorry, I do not recall the discussion of partial dependence plots from the ML course. Something I have not managed to get around to study yet to the extent that I would like
It’s like you replace let’s say a particular year value in all the rows (make them same for all the rows in the dataset) and then predict what the RF will predict as the sale price,
Doing this for different years will help us to get the Partial dependence…
(Hope I am correct)
So I was watching lesson 5 and 6 and I saw Jeremy recommended splitting the data into training and valid sets manually when the data has temporal ordering. TIL there’s a cross-validator in sklearn called TimeSeriesSplit.
Have anyone tried that out?
can you replicate the ggplot() idea that Jeremy did in his data on your dataset?
That may help me interpret your pdp plot. My first guess, is you’ll find an error in that plot. lets see 
I had done that also,
There was a sharp dip in the value when the year was around 2009-2011(but it was not at all negative, well well it depends on the random splitting then, which it should be as this dataset is basically the Singapore Housing Re-Sale, the market did crashed and so were the fall in the prices were justified…
These links do not work anymore? Where can I find all the 12 videos for Machine Learning?
The links above are working(atleast when I clicked the 1st one)
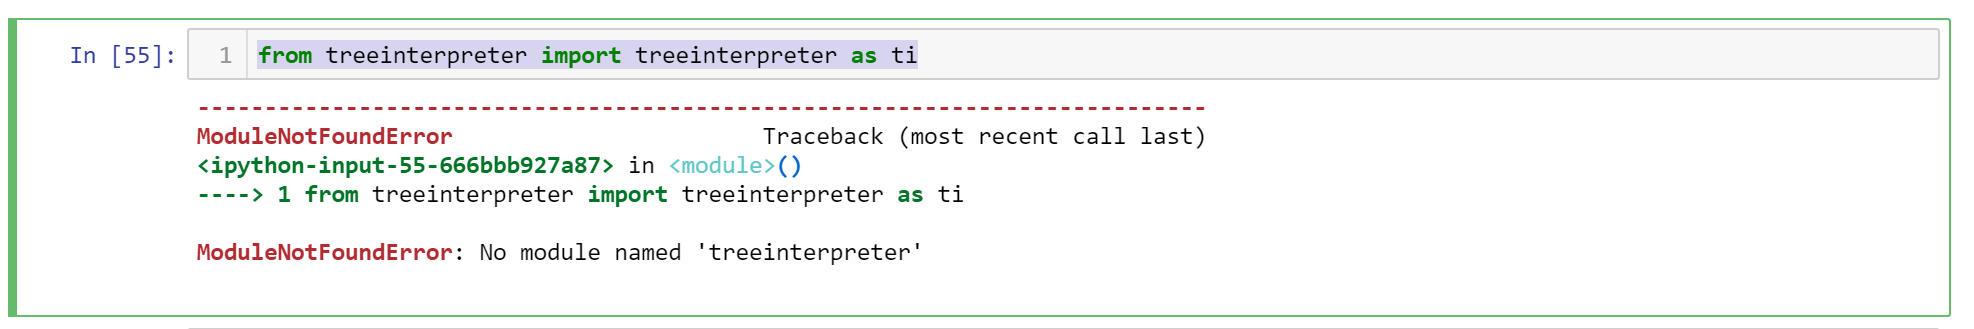
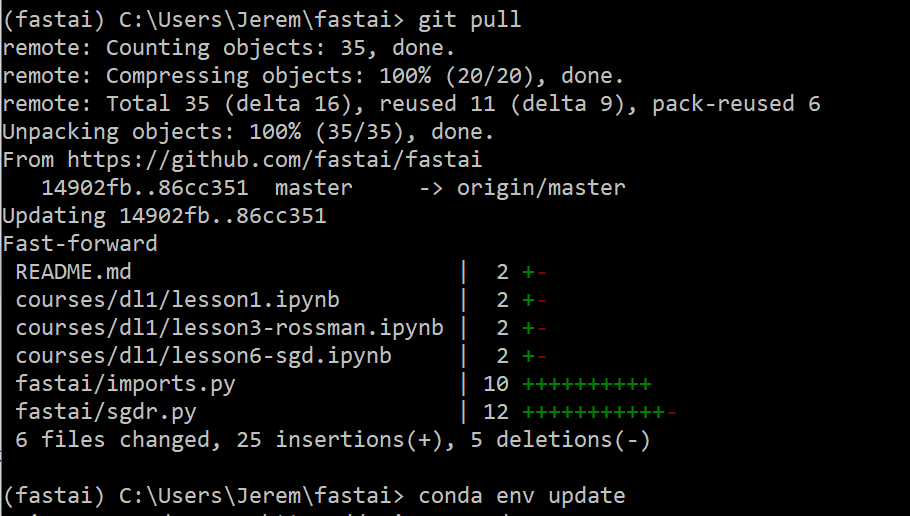
Did anyone else run into this issue? This package is extremely amazing and would like to be able to use it, but it seems my clone of the repo doesn’t have this. There is nothing on the forums on this so if there is anything you can do to help thank you in advance
Problem treeinterpreter No Module named
from treeinterpreter import treeinterpreter as ti
Yay…this is awesome. I am already 2 courses in with DL and will do the ML in conjunction with the DL course! Thanks heaps!
Success!!!  Thank you so much it worked for me
back to your pdp-plot way up the thread now…
check the dates 2000 -> are correctly going in. (note x axis labels 0 -> )
you didn’t post any code. maybe a new thread with both pics and some code would help if this doesn’t fix it
That’s because it has been encoded categorically…
(Will this cause the anamoly(because of scales)?)
Will share the code soon
I have noticed the method of calculating feature importances for random forests used in the videos does not seem to match the method used by sklearn. Further to this (unless i am missing something) it appears that under the hood the fastai library method just uses the sklearn method and so doesn’t make the calculation described in the videos.
Specifically the method used to calculate feature importance in the video describes a very general purpose method of randomly reordering one of the features across the training set and then measuring how much the “score” of the model decreases by.
In contrast the sklearn definition of feature importance appears to be a more tree specific technical one - namely the mean weighted decrease in variance for all splits including this feature.
I can’t imagine that these two definitions are equivalent, I’m probably going to do a few experiments to see how they vary in practice. Does anyone else have an idea of how the two methods compare?
Am I missing something obvious?
Ah ok it’s left as an exercise at the end of lesson 7! The two methods do return similar but definitely not the same results.
Awesome for Stacking/Ensembles…