Question on pdp-plots
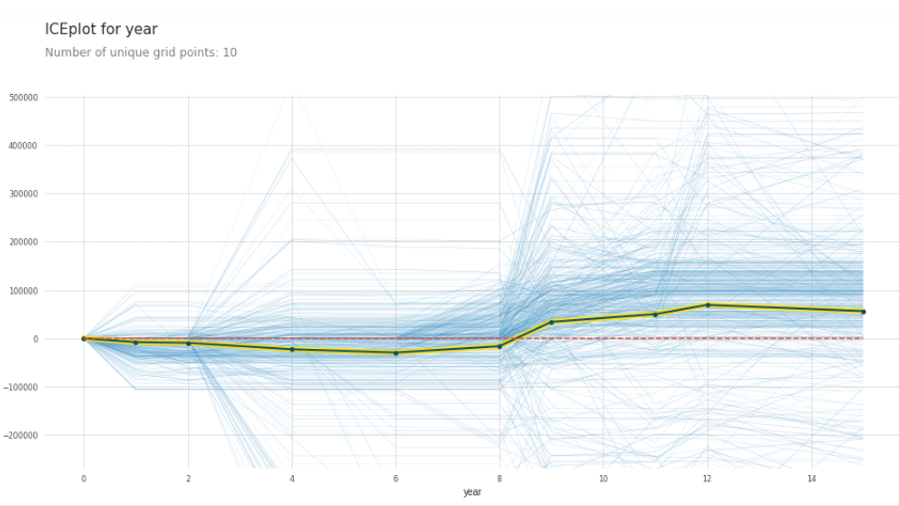
How to interpret this pdp-plot (its from some other dataset)( a lot of -ve lines)
pdp-plot
Dataset is basically on re-sale of house prices